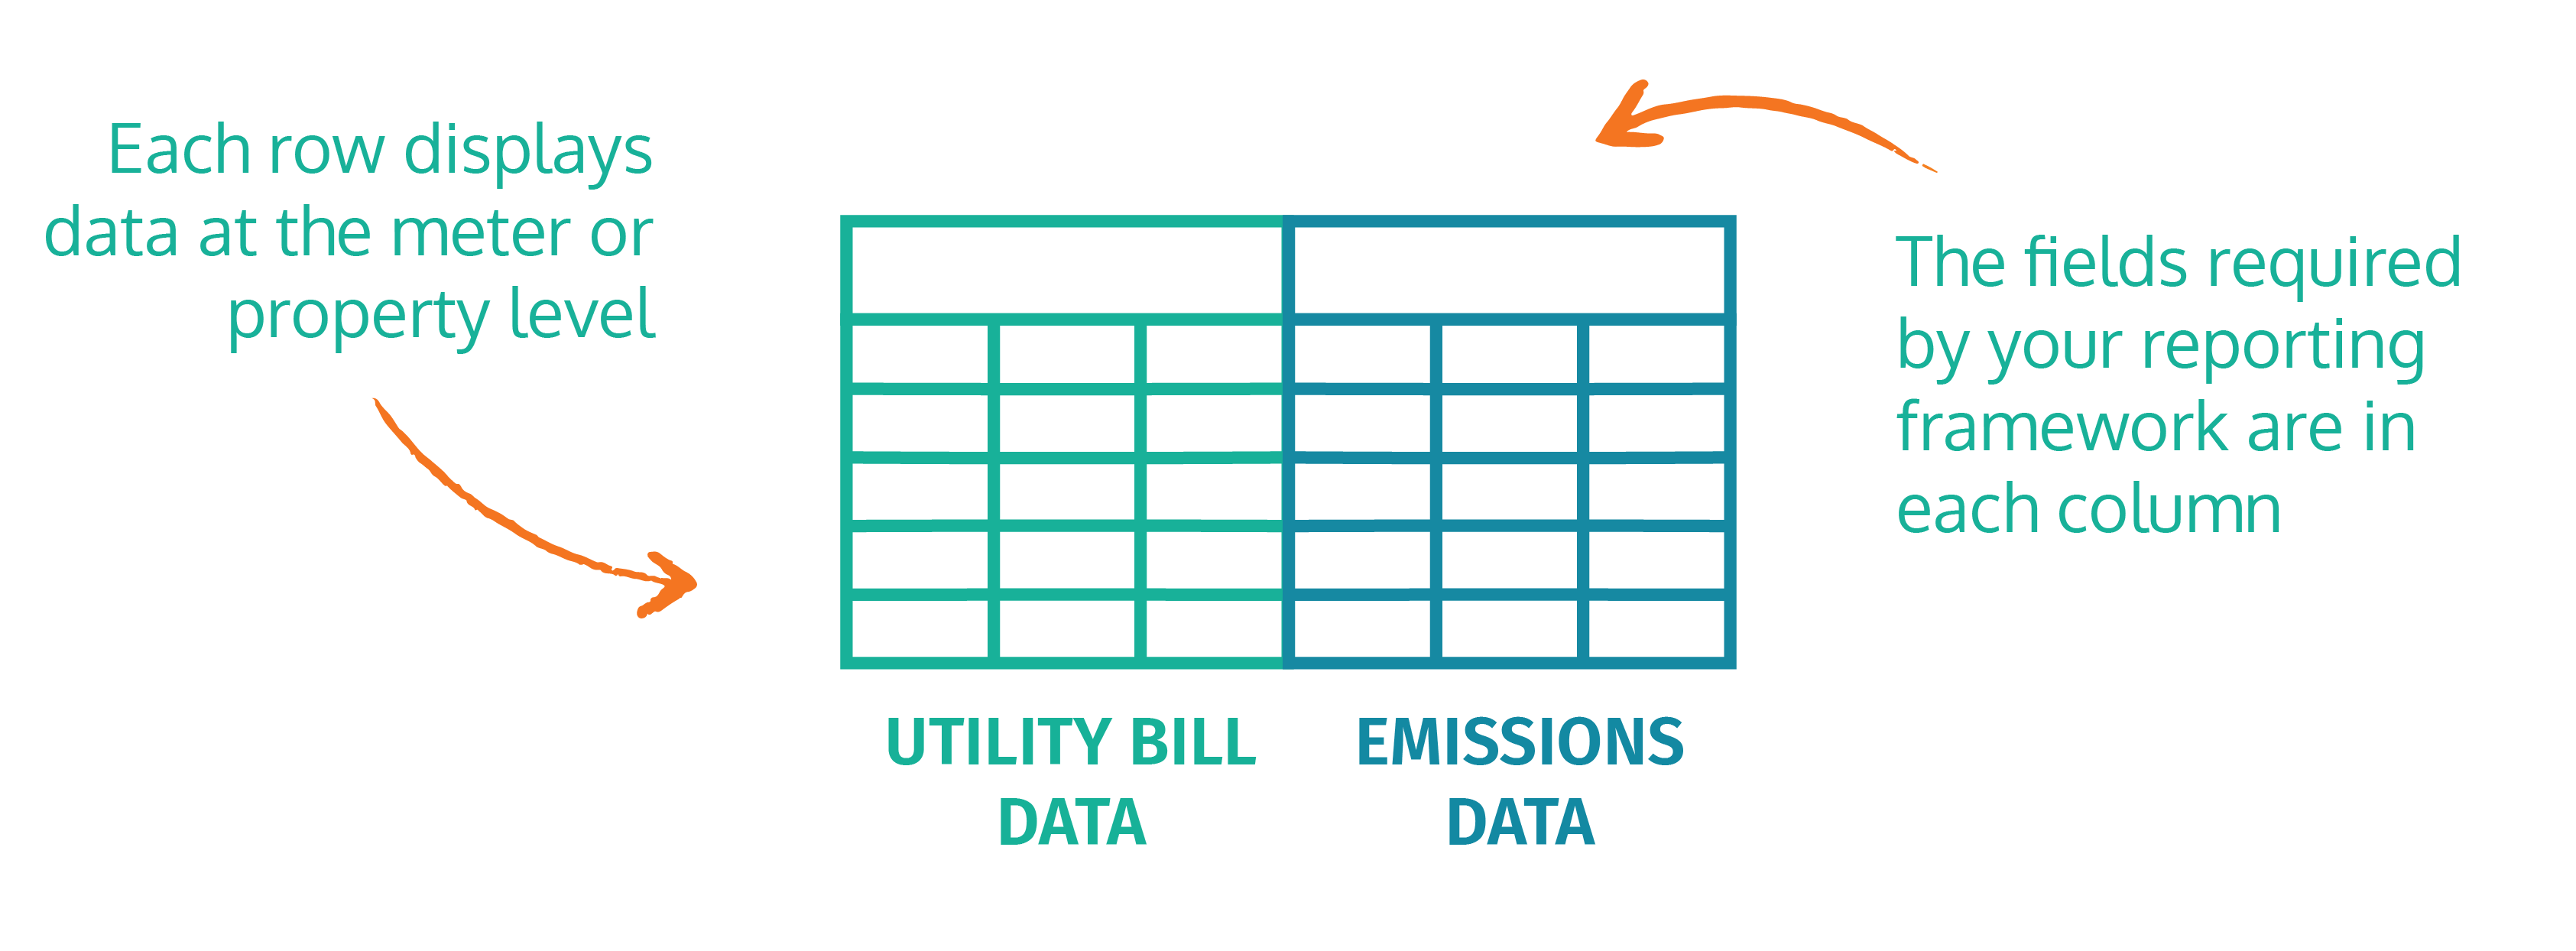
An image – or in this case a spreadsheet – can be worth 1000 words. GLYNT produces Scope 2 emissions data in a simple spreadsheet format. Transparent. Accessible. Ready to Use.
Scope 2 emissions are generated at a site from the use of electricity, natural gas, heating oil and so on. An air conditioning system, for example, generates Scope 2 emissions through its use of electricity.
Too often this data is trapped in a siloed workflow: Complex utility bills are sent to a place, data returns. It is immediately put into software to view. Then the data is shipped off to an ESG reporting software layer and published. No one knows how to track the reported emissions back to the originating documents.
“We put emissions data into spreadsheets to create broad, easy access to this important information. See the data, play with the data, tweak the data. Start the conversation about what to do next.”
GLYNT is different. Provide utility bills, get a spreadsheet back. Every row is a property or meter and has a hot link back to the original document. You can see exactly what data was taken from that document; you can check GLYNT.
And the emissions data is accessible. We want you to play with it! Map the data using the included location coordinates (latitude and longitude). Look at energy use by property and by square foot. Walk the C-suite through a simple monthly report, one that lays out spending, energy use and emissions for each site. Simple but effective.
And when you’re ready, import the data into other software. As we all know, reporting is not enough. Use GLYNT partners to help you gain further insights, get better energy contracts and to reduce energy and emissions at key locations.
Getting data with GLYNT is a key first step. But who knows where that spreadsheet will go and what conversation it may spark. Sometimes old school – a simple spreadsheet – is indeed just the right solution.
