The pace of ESG investing and disclosures have left us all breathless. And sometimes, at the family dinner table or the weekend barbeque we can’t even answer the basic question: Do ESG scores really matter? Do they impact company value?
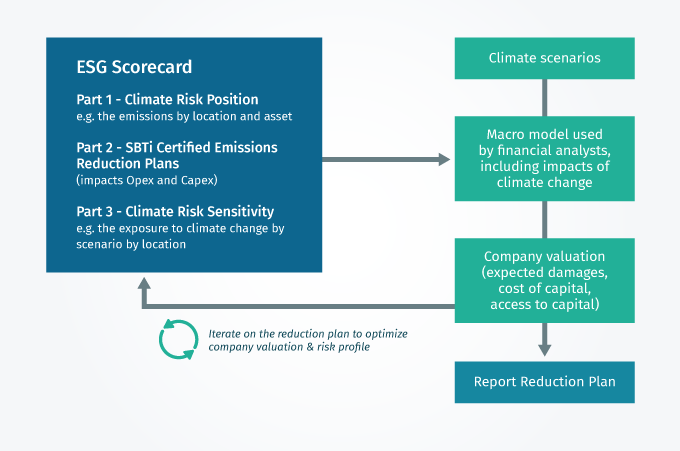
The graphic below is a quick primer. And any chart that has five moving parts is always a bit hard to remember, so no worries if you failed the weekend barbeque quiz!
From ESG Scorecards to Financial Impacts

The story has two starting points. On the left is the company’s ESG Scorecard. We’ll look at just the emissions component. This data file is the baseline emissions recorded at every site, the emissions reduction plan set by management, it’s impact on operating and capital expenses, and the company’s exposure to physical climate risk at every location, such as floods, wildfires and heat. The second starting point is at the top, the Climate Scenarios.
The investor-side financial analyst combines the data on the company’s emissions position with the climate scenarios. The scenarios are long, through 2050, and contain detailed data on physical climate risks around the globe as well as a broad macroeconomic model that has been expanded to include the costs of climate change.
Consider three alternate futures:
-
- Everyone cooperates and reduces emissions. This scenario has less physical damage from climate change to the company of interest, but the company must make emissions reduction investments which reduce profitability.
- No one really reduces emissions. This scenario has high costs of physical damage for every company. Profitability declines.
- Some companies reduce emissions but not most. In this scenario there are high costs from physical damage and high costs for those who reduce emissions.
The investor-side analyst runs each scenario and models out the company’s potential losses. This impacts valuation, revenues and expenses. The analyst also rates the company against its peers.
A corporate financial analyst, e.g. inside the company, uses this framework to optimize the amount of climate exposure, not under-investing and not overpaying for emissions reductions.
For both analysts, there is a direct feedback loop between today’s level of emissions and the company’s valuation. Today, about one-third of investor-side financial analysts are thinking along the lines of the graph above. The connection between ESG Scorecards and valuation can’t be ignored.
