The GLYNT.AI Guide
Total Cost of Ownership (TCO) for Sustainability Data
Introduction
Sustainability teams must build a solid business case for all activities, including how sustainability data is prepared. This Guide walks through a total cost of ownership framework for sustainability data preparation, revealing the hidden costs of in-house systems. Use the Guide to get a realistic and verified estimate of the cost to build an audit-ready data system and compare that to the cost of GLYNT.AI’s automated service.
What Is the Total Cost of Ownership (TCO)?
The TCO is lifetime cost of deploying, maintaining and using a software system. The costs include in-house time and effort, as well as vendor fees. TCO calculations should recognize that full costs include deployment, maintenance and usage which can vary over time. The TCO paints a complete picture.
Use the TCO Calculator From GLYNT.AI
Track the Calculations against The Tech Stack for Sustainability Data
Why Is the TCO of Sustainability Data Preparation Important?
Sustainability teams are struggling with data preparation tasks and often report that data preparation is 80% of their time and effort. Meanwhile, ESG reporting, sustainability and carbon accounting software leaves the data preparation task to the customer. Data preparation is a significant, neglected cost center.
Compounding the cost challenge is the scattered nature of sustainability data and reporting. Often global teams are asked to key in data at their location, putting expensive staff in a data entry role. Headquarters staff then chase down missing data, data errors and points of confusion. The cycle starts all over with staff changes.
The TCO calculator is a reliable way to determine the true costs of this scattered activity, providing a full picture, including in-house audit preparation time, and data quality testing. Whether evaluating automation of a current data system, or considering a software + data preparation bundle, use the TCO approach for an apples-to-apples comparison.
How to Use the TCO Calculator
GLYNT.AI built the TCO calculator using a bottom-up approach, with detailed calculations for every data preparation activity. To customize results, the TCO calculator starts with three simple questions:
How many sites (stationary assets) are included? How many mobile assets?
How many sites have manufacturing, industrial or data activity? This makes sustainability data more complex.
Will waste data be included? A second vector of complex sustainability data.
Once the user answers these questions, the calculator shows a cost comparison of in-house systems versus automated data services from GLYNT.AI.
To learn more about levels of data quality see:
The Reliability Index for Sustainability Data
How Integrated Reporting Leads to More Accurate and Reliable Data
The Bottom Line
70%+ Savings from GLYNT.AI’s Automated Data Services
The TCO calculator has a very strong conclusion, at every scale of data preparation: Using GLYNT.AI’s automated data service saves time and money.
Data + Software = ROI
Buying sustainability software? Include GLYNT.AI to save money
For many companies, the monetary savings from data prep are quite significant, and more than cover the sustainability software license. So save money while getting a data + reporting bundle!
What Does the TCO Calculator Cover?
Two images show the span of coverage for the GLYNT.AI TCO Calculator.
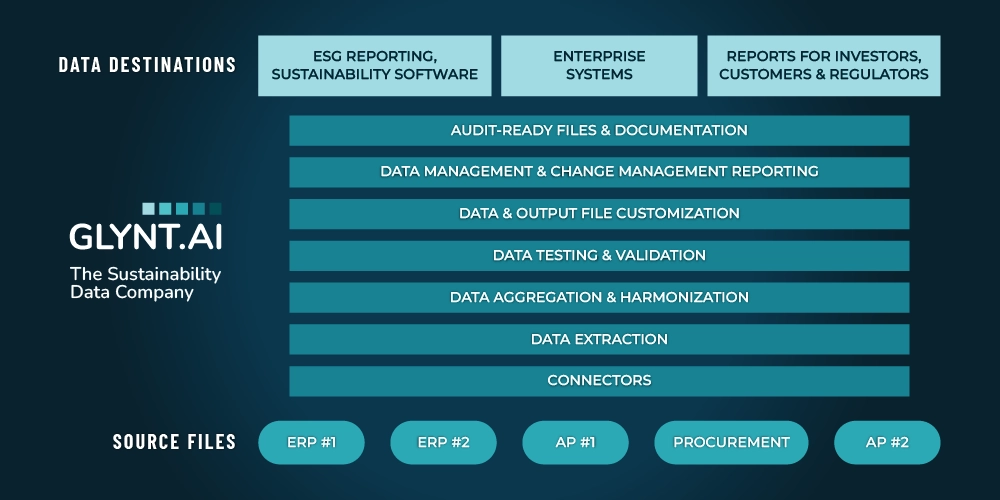
First, the Sustainability Data Tech Stack lists all the features and functionality of the GLYNT.AI automated service. Some customers may believe this tech stack is overkill, that simple data entry will suffice. But without high-quality granular, fresh and accurate sustainability data, sustainability teams can’t drive business change. They remain a cost center and fail to transform – supported by awesome data – into a center of profit and value creation.
The Sustainability Data Tech Stack from GLYNT.AI
The second image shows the level of data quality available by type of data system. Because they are not automated, most in-house systems capture only 10 – 12 fields. Even so, data quality is poor. And when scaling to audit-ready levels, it becomes quite difficult to reliably deliver the data, as there are so many ad hoc steps.
But key savings opportunities, such as energy or water, come from the analysis of more granular data. GLYNT.AI’s automated system delivers more than 75 fields, including enriched, granular data that drives savings calculations.
Data Quality by Type of Data System
Reporting
Tracking
Audit-Ready
Finance-Grade
Expanded Reporting
Expanded Finance-Grade
The columns in the table are samples of the types sustainability data systems often in use today. The rows are the dimensions of reliability. Multiply the individual performance metrics shown by row to calculate the Reliability Index for a selected system.
Use this table and this method to score your data preparation system.
The Key Result
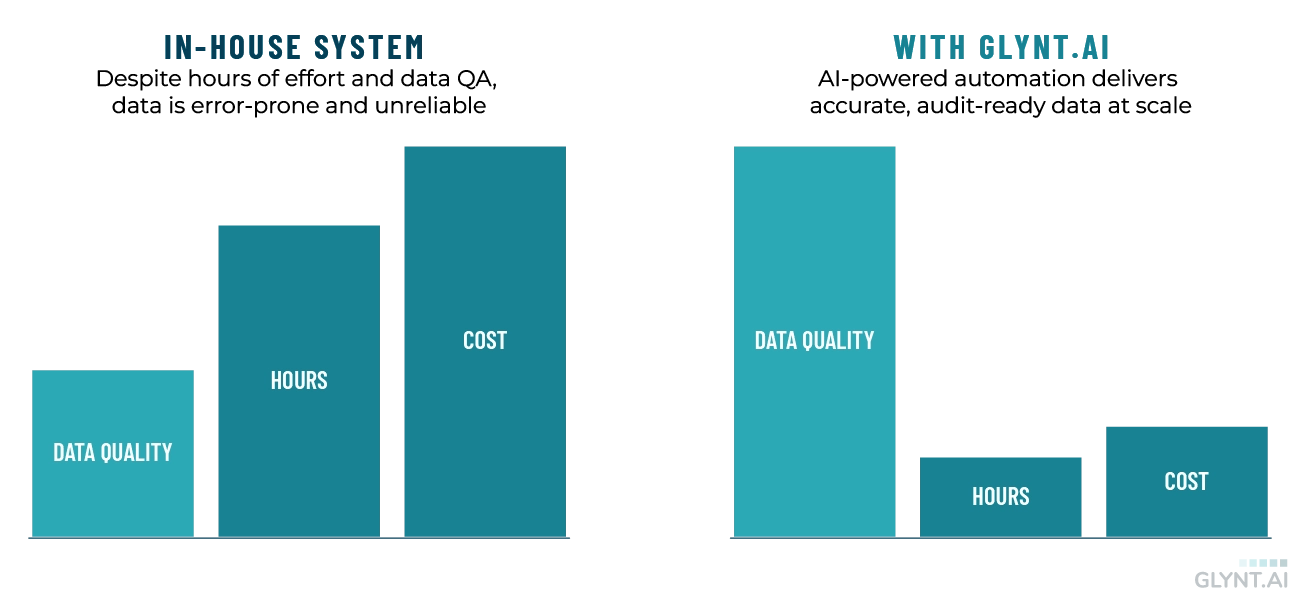
We’ve been using the TCO Calculator of some months, and stress tested it across key dimensions. A key result emerges at every scale and complexity: An automated data service from GLYNT.AI saves time and money.
IN-HOUSE DATA PREP VS GLYNT.AI
Insights
As you work through your own costs, here are some general insights from our TCO calculator. They are likely to apply to nearly every data system.
- Rethink the number of fields. Current in-house systems capture very few data fields per usage event because more fields rapidly escalate costs and effort. For example, companies simply calculate and report kWh per site per year, missing the opportunity to examine the monthly data detail for savings opportunities. Automated services typically deliver a rich set of fields at no extra cost.
- Data QA raises costs and leads to more delays. Every time there is an increase in data quality, in-house systems have to set up deeper and more complex data QA efforts. Hours of effort rise sharply, and soon there is simply not enough hours in the day to consistently meet deadlines. So overall data reliability, as measured by the Reliability Index above, does not increase by adding Data QA.
- Audit-Ready archives cut audit costs. Setting up data, reports and documentation for auditors throughout the year saves that crunch time hassle and also reduces the stream of auditor questions that disrupt your other work. Auditors have worked out an efficient system for financial audits, use the same setup to save money on sustainability audits.
- It takes a system. Reliable data comes from automated flows. These handle data more efficiently and the code base grows smartly over time, accumulating more and more error checking and prevention. But consistent data sets also drive data reliability. It takes a system, such as Integrated Reporting, to stabilize data sets, avoiding reporting errors from omitted data.
- Point solutions have limited impact. While a data preparation system delivers the full efficiency of automation, audit-readiness and compliance, point solutions – such as a utility data feed or enhanced OCR for invoices – solves a point problem, but leaves the other tasks undone. The TCO calculator shows point solutions save a bit of money, but far larger savings arise from leveraging the built-in features of a complete system.
TCO Details
The GLYNT.AI TCO calculator was built from the bottom up, examining the in-house cost to build every component of a data preparation system. The calculator is customizable by number of stationary assets, number of mobile assets, complexity of operations (e.g. manufacturing or not) and types of data services included. The details and assumptions of these calculations are reported in this section.
User Inputs:
The calculator has the following inputs:
- Number of sites (buildings or unique service addresses)
- User selection of the type of data service
- Electricity
- Natural gas
- Other fuels
- Water
- Scope 1 purchases
- Waste
- Percent of sites that are manufacturing, industrial or data centers (these have a higher level of data intensity)
If calculating the cost of a blended system, the user is also asked:
- Percent of sites covered by the point solution
- Cost of the point solution per site
Staff Costs:
The following staff positions and annual salary figures are used in the TCO calculator:
USA
- Data entry cost – from the US BLS (1)
- Data analyst (QA specialist) from the US BLS (1)
- Mid-level Software developer / GRC staff – from Indeed.com, Chicago, IL
- Project Manager – from Indeed.com, Chicago, IL
Other Locations
- Similar local data sources can be used as needed
Overhead Rates
- A 28% overhead rate (taxes, benefits, bonus) is applied to the salaries in the USA and an 18% overhead rate is applied in other countries
Standard Assumptions:
- The service life of a data preparation system is four years
- The setup costs of a new system are divided by four and added to the annual costs of data preparation, resulting in an average TCO annual expense
- The calculations are repeated throughout for 10 fields per source file (simple data set) and 45 fields per source file (full data set). While costs rise with the number of fields this is not the key driver of the general results.
- Hours of effort by task is based on GLYNT.AI experience and that of our customers.
- No IT system costs, such as cloud storage, cloud compute, additional user licenses to software or other fees are included.
Types of Data Preparation Systems and Their Components:
The types of data preparation systems are defined by their level of data quality and use case. This is described in the Reliability Index resource. (2) The types of systems included in the TCO calculator are:
- Reporting. This includes source file provision and data entry.
- Tracking. This includes source file provision, data entry and limited data QA.
- Audit-Ready. This includes source file provision, automated data capture, moderate data QA, and preparation of audit-ready files.
- Integrated Reporting. This includes source file provision, automated data capture, extensive data QA and reconciliation, customized data preparation, preparation of audit-ready files and the cost of standard GRC compliance.
Cost Calculation Method by Component:
Source File Provision:
Companies must find Source Files that reside in various business systems (AP, ERP, procurement, utility websites and so on) and transfer Source Files to their sustainability teams for processing. Many of GLYNT.AI customers previously had staff at each global location find and submit the Source Files. The TCO calculator estimates the cost of Source File provision via four methods and uses the average in the TCO calculator.
Data Entry:
Most companies start sustainability reporting with data prepared by an in-house team or a contracted data entry service. The data is typically captured in spreadsheets, but can also be directly hand-keyed into software. GLYNT.AI uses industry standard keystroke and invoice processing productivity rates to calculate the cost of data entry.
Data QA:
Unfortunately data entry is error-prone and most teams must build a semi-automated system of checks and corrections. As with invoice processing, the cost of fixing an error increases as the data moves through the system as there is more to track down and research. Data QA is done by a data analyst, who earns more than data entry staff.
For the purposes of comparison, GLYNT.AI built cost components for data QA at three levels: Semi-automated, Audit-Ready and Integrated Reporting. Semi-automated data QA includes direct attack by additional hours by a data analyst, and also double data entry, in which every data item is keyed twice and the data QA team focuses on the differences in data entry. The average cost of these two methods was used in the TCO calculator. The Audit-Ready Data QA does a complete single-threaded check on each data element, e.g. there are no cross-checks or double-checks. The Integrated Reporting uses a source of truth to track and manage every Source File, and reconciles to double-entry bookkeeping and other double-checks.
Preparation of Audit-Ready Files:
This cost component includes the cost of setting up an audit-ready archive, the cost of preparing data management and change management reports, and the cost of documentation. In addition to annual expenses, there is a setup cost to the archive, and this is amortized over four years, the service life of the data system.
Customized Data Preparation:
Once prepared, sustainability data can be sent to various software applications and systems, each with a specific data format and data model. The sustainability team must prepare their data for seamless integration. In addition, customer reports, regulatory reports and other output formats may require the calculation of specific metrics and KPIs. This work is typically done by a developer, in coordination with a sustainability expert, working as a small team under a project manager. Because software and reports change, as do the Source Files, there is an annual cost to maintain this customization code too.
GRC Compliance:
IT systems are made private and secure by layers of testing, controls and processes, known as Governance, Risk and Compliance (GRC). A sustainability team, supported by developers and experts from IT, will need to comply with their company’s GRC requirements, as the in-house endeavor is building a new enterprise system. This is an expensive task for any in-house team and typically it takes months to implement. While GLYNT.AI has made this investment, we also leverage it across all customers. GLYNT.AI is essentially a GRC-compliant system that is plugged into the enterprise tech stack. The cost of GRC compliance is applied only to the Integrated Reporting level of data quality, as it is assumed it is too expensive and time consuming at lower data quality levels.
Method for Blended Systems:
On occasion a customer would like to compare the costs of an in-house system that includes point solutions by another vendor. The TCO calculator enables this by adding two user inputs: Percent of Source Files processed by the vendor and the average fee paid per file. Depending on the vendor solution, GLYNT.AI then merges the cost of two workstreams (in-house, and that covered by the vendor’s services) into a single workflow. Point solution vendors are usually cheaper at their tasks than in-house systems, resulting in a lower TCO for a blended system. But the full comparison is in-house vs blended vs GLYNT.AI. Because GLYNT.AI is a complete and fully-features system, the savings from using GLYNT.AI are significant, whether migrating from an in-house or a blended system.
Savings Calculations:
GLYNT.AI charges for its services either by site or per row of prepared data delivered. WIth the user inputs, an estimate of the fees for the GLYNT.AI service is made. This annual expense is compared to the TCO annual expense. Setup cost and fees are amortized over a four year service life. GLYNT.AI costs include the expense the customer may have in managing GLYNT.AI services.
Small Commercial:
Smaller businesses may have fewer sites or less complicated reporting needs. GLYNT.AI cost-effectively serve these customers with proven methods and streamlined Source File capture.
Sources:
1) Occupational Employment and Wage Statistics, U.S. Bureau of Labor Statistics
2) The Reliability Index for Sustainability Data, GLYNT.AI
Contact GLYNT.AI

New to GLYNT.AI
© 2025 GLYNT.AI, Inc. | #betterdatafortheplanet | Terms of Use | Privacy Policy | Compliance Framework


