The Sustainable Way to Prepare Sustainability Data
OVERVIEW
Some months ago, GLYNT.AI set out to document our innovative machine learning in regards to its energy and water use and levels of carbon emissions. We wanted to comply with the emerging NIST and ISO standards for compliant AI. (1) And we wanted to see how our system, which uses ‘Few Shot’ Machine Learning (ML), compared to recent research findings on carbon emissions by AI done by Meta, Hugging Face, EPR and LBNL.
While our goal was straightforward, the path through the calculations was not. We found huge emotional reactions to AI and data centers in the press, all relying on thinly-sourced projections. We found silos of chatter: AI talking to AI experts; energy talking to energy experts; and climate folks trying to bring it together. The simple tracking of units of measure between these silos is a challenge.
This white paper documents our methodology and our results. We also included a longer section, Details, that is a more complete discussion of the methodological issues, references and reconciliations we used. Our hope is that this white paper can be a guide for sustainability and finance teams that need to solve the same reporting challenge, and that we are setting up a calculation framework that will improve every year as more data and higher-quality data becomes available. Look for annual updates in this report from GLYNT.AI.
As you read this report, here’s the key caveat: Look at the relative levels, not the fourth decimal place. Throughout sustainability reporting there is a tendency to treat an estimate as a fact and mindlessly string up four to eight data transformations without regard to confidence levels, significant digits and the stale nature of the data. While these issues pervade the sustainability calculations for energy and carbon emissions of AI, the relative levels of our findings should be robust to this data challenge.
In our work, we compared the emissions and energy use of GLYNT.AI to that of LLMs, based on recent work by Hugging Face. (2) The Hugging Face researchers carefully compared LLMs by scale (number of parameters, number of tokens), split of energy use between training and inference, and so on. They also benchmarked usage by the nature of the task to be completed. GLYNT.AI selected four of these tasks as comparable to the Few Shot ML we built.
#1 Purpose-Built Machine Learning is Resource Efficient
The use of energy and water by data centers is a top concern in the energy markets and by those watching the continuing increase in worldwide carbon emissions. In contrast, GLYNT.AI, which has built and deployed ‘Few Shot’ machine learning (ML) to address the sustainability data challenge, and this system has a light footprint for energy, water and emissions.
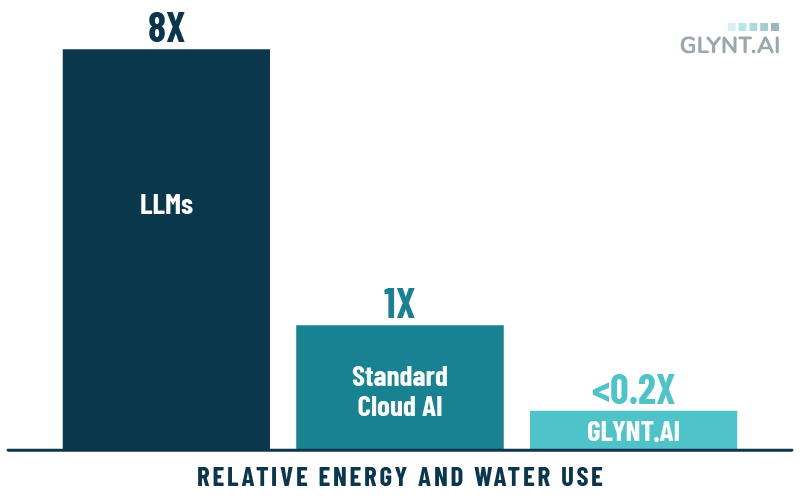
The graph to the right shows a summary of our central findings. The GLYNT.AI result is from the analysis described below. EPRI (10) provides estimates of typical cloud energy use for a search, and the LLM equivalent. The LLM has 8 X the energy usage.
Note that an increasing share of data centers usage is from AI, making it the distinction between energy and water use between LLMs and typical cloud computing a moving target and an increasingly difficult comparison to make. The relative levels of energy, water and emissions are so different that they are robust to this issue.
GLYNT.AI Uses Less Energy And Water than LLMs for Comparable Tasks
#2 GLYNT.AI’s Few Shot ML is an Efficient Form of AI
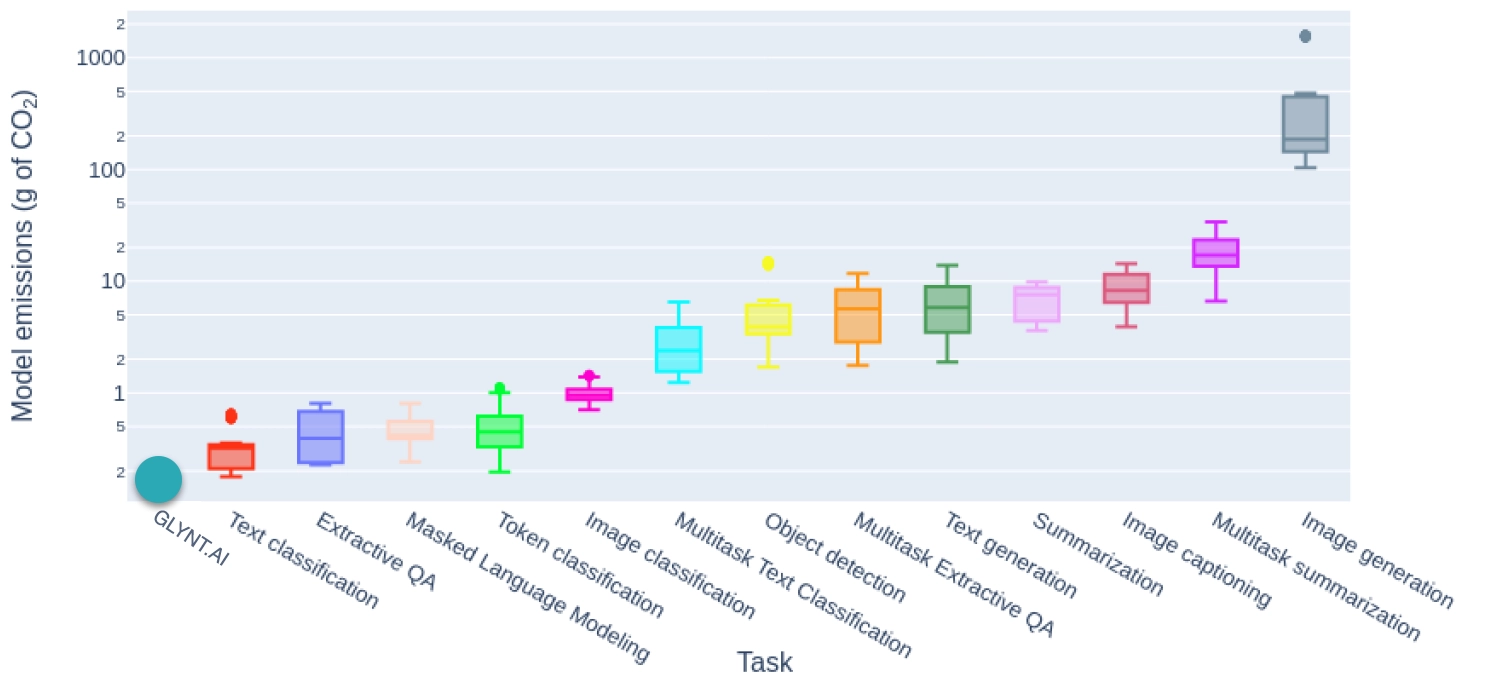
The tasks on the left of this graphic are more straightforward, such as “learn from training data, repeat the task on new data,” and the tasks on the right are more complex, such as “create a new image from these selected themes.”
The results show that the sum of emissions from the four comparable tasks (text classification, extractive QA, token classification and image) is much lower than any single LLM task. The future of AI will be an ecosystem of AI algorithms, each with a sweet spot of usefulness (accuracy and efficiency). LLMs are incredibly data hungry, and GLYNT.AI’s role is to deliver accurate, verified data to the ecosystem.
Carbon Emissions for LLMs By Task
(per 1000 inferences, excluding training and infrastructure)
Source: GLYNT.AI calculations; Hugging Face (2)
#3 GLYNT.AI’s Very Efficient Training & Inference
To take our analysis further, we looked at how AI is done, through training, inference and supporting infrastructure. Our focus is on the four tasks that are reported in Hugging Face’s analysis of LLMs that are also portion services delivered by GLYNT.AI. While GLYNT.AI is highly accurate (above 98%), LLMs are not very accurate for these tasks. Recent research shows a less than 50% accuracy rate, even when boosted by RAG. (5)
To operationalize this calculation several assumptions are made. First, we normalize by accuracy rate to enable an apples-to-apples comparison. This means that effectively LLMs need nearly twice as much training and inference per task to reach a comparable accuracy rate as GLYNT.AI. Second, we assumed that the LLM’s emissions footprint was split evenly between inference and training. Hugging Face reports a wide range of data snippets on this matter, ranging from 60% inference, 40% training at Google to 90% inference, 10% training at AWS. (5). GLYNT.AI’s Few Shot ML works quite differently, in a nearly blended training-inference mode and so we report only the the combined emissions intensity for inference plus training.
As the table shows GLYNT.AI’s Few Show ML emits less than 1% of the carbon that LLMs do per comparable transaction. If training is excluded from the LLM emissions, GLYNT.AI remains below 1% on a relative basis. If it is assumed that LLMs are perfectly accurate for these tasks, GLYNT.AI is still less than 1% of the LLM’s emissions.
When looking at the entire system, AI training, AI inference and supporting infrastructure, GLYNT.AI is 87% that of LLMs. We believe that this result is largely due to scale. Data centers and researchers from large companies are far more likely to be able to parse their infrastructure usage into that dedicated to AI and that used for other purposes. GLYNT.AI has one product, and all of our infrastructure computing goes into the delivery of our product. We suspect that as GLYNT.AI grows, we will be able to divide our infrastructure usage more precisely, but we also suspect that as a one product company with a highly efficient AI algorithm, we’ll always have a relatively high share of infrastructure usage.
Carbon Emissions (Kg CO2e) per Successfully Completed Transaction
ACTIVITY
GLYNT.AI*
LLM**
GLYNT.AI/LLM
* Per 1000 fields delivered to the customer (100% accuracy rate)
**Per 2000 inferences (50% accuracy rate assumed)
Source: GLYNT.AI calculations; Hugging Face (2).
The Hugging Face research explores the role of scale, complexity and other factors. We used their summary measurements by task and selected four tasks that sum to a comparable service as provided by GLYNT.AI: text classification; extractive QA; token classification; and image classification. We also assumed that LLMs have a 50% accuracy rate on these tasks, which means they will have twice as much training and inference per successfully completed transaction.
Hugging Face reports the energy use of inference only for the tasks selected. Inference energy use per transaction depends on a number of factors, including user adoption, lifecycle of the model, amount of retraining and so on. We assumed that the LLM’s footprint was split evenly between inference and training. GLYNT.AI’s Few Shot ML works quite differently, in a nearly blended training-inference mode. We cannot split our data center usage by AI task, and report only the combined inference plus training result.
As seen in the table above, GLYNT.AI’s Few Show ML emits less than 1% of the carbon that LLMs do per comparable transaction. If training is excluded from the LLM emissions, GLYNT.AI remains below 1% on a relative basis. If it is assumed that LLMs are perfectly accurate for these tasks, GLYNT.AI is still less than 1% of the LLM’s emissions.
When looking at the entire system, AI training, AI inference and supporting infrastructure, GLYNT.AI is 87% that of LLMs. We believe that this result is largely due to scale. Data centers and researchers from large companies are far more likely to be able to parse their infrastructure usage into that dedicated to AI and that used for other purposes. GLYNT.AI has one product, and all of our infrastructure computing goes into the delivery of our product. We suspect that as GLYNT.AI grows, we will be able to divide our infrastructure usage more precisely, but we also suspect that as a one product company with a highly efficient AI algorithm, we’ll always have a relatively high share of infrastructure usage.
#4. A Fast-Changing Environment
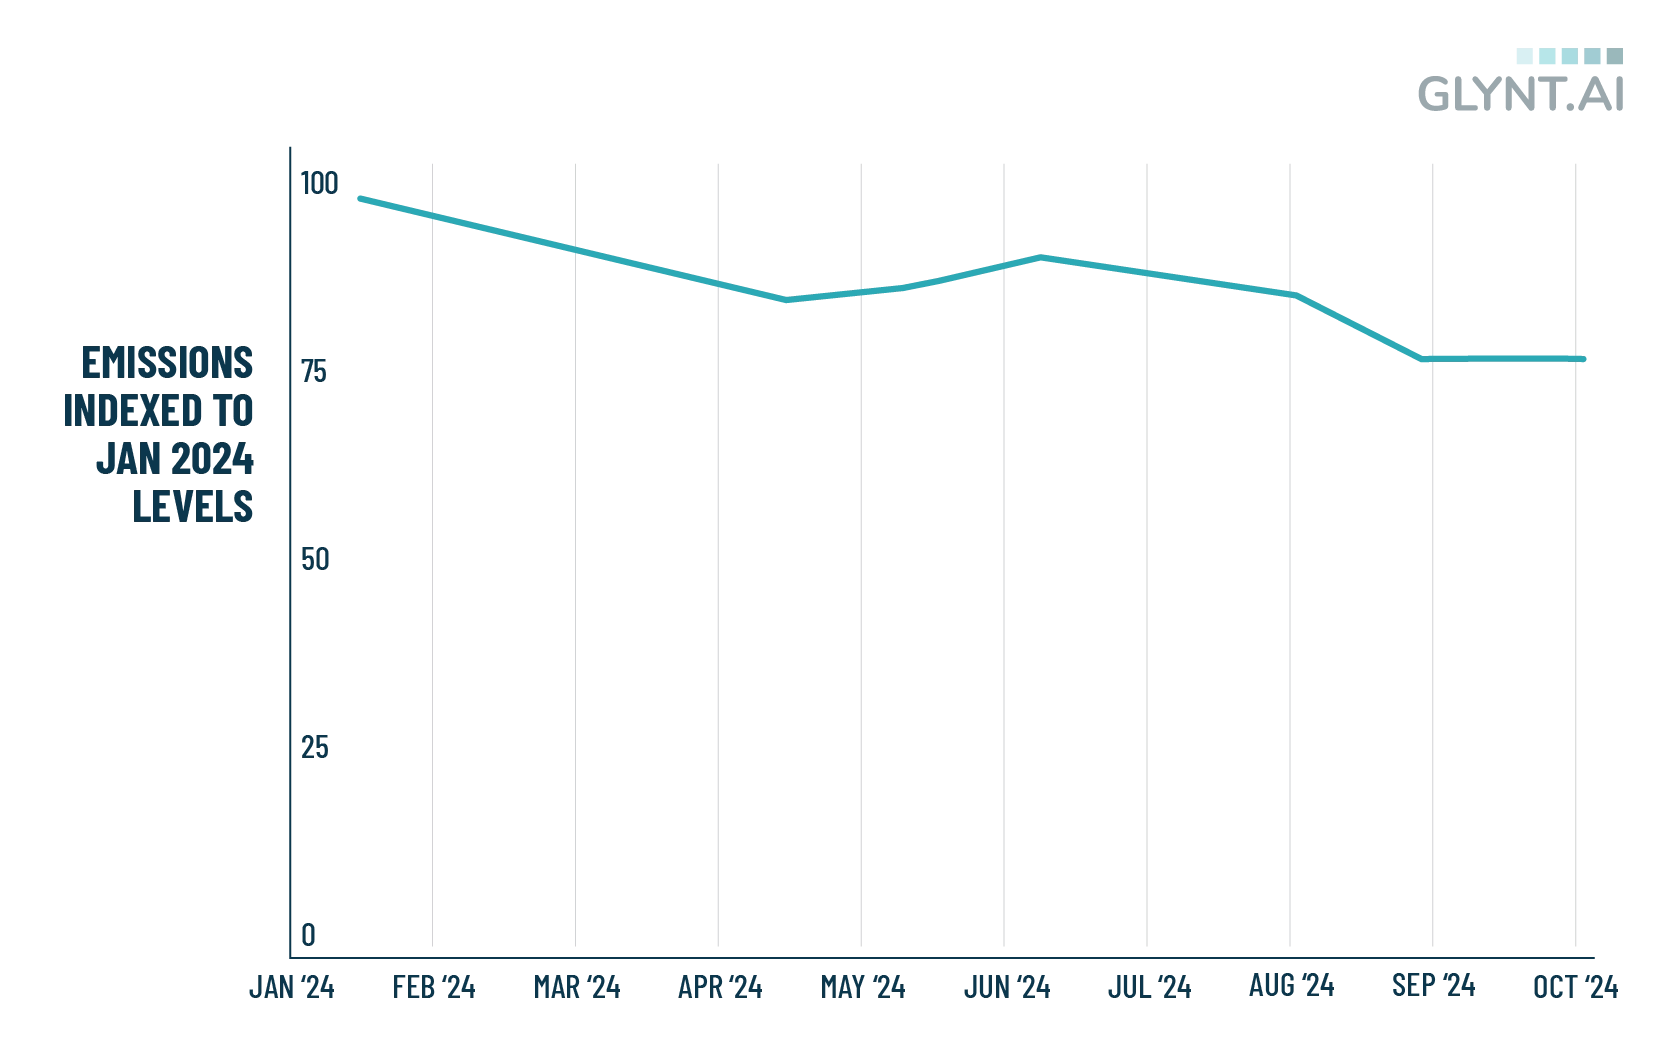
During the period of study GLYNT.AI made a number of internal changes in our AI system. The result was a 25% decrease in monthly carbon emissions.
These changes made at GLYNT.AI included:
- Higher levels of automation as source files are received. We’re doing less overall work for each file
- Higher initial rates of accuracy, leading to less retraining or rework
- Improved categorization of source files during onboarding, which reduces the number of training models used.
We make mention of our efficiency gains because we’re delighted, but also we’re confident that GLYNT.AI is not the only tech company constantly balancing and rebalancing tasks in an AI system to increase efficiency. Studies show the same downward trends in data center operating efficiency (as measured by PUE), in energy use per chip in data center servers, server deployment and so on.
25% Reduction in Carbon Emissions by GLYNT.AI During the Study Period
(MT CO2e, January 2024 = 100)
#5 The GLYNT.AI Reference Data Set
GLYNT.AI Environmental Footprint for Sustainability Data Preparation
(per 1000 rows of data prepared by GLYNT.AI)
RESOURCE
INTENSITY
UNIT OF MEASURE
In Sum
This detailed analysis has shown that GLYNT.AI is a highly efficient sustainability data service with a very low footprint for energy, water and emissions. GLYNT.AI plays a key role in the AI ecosystem; customers can use our AI to produce accurate, verified and enriched data for best performance by enterprise AI, e.g. LLMs. And our results have shown that GLYNT.AI customers are not making an AI vs sustainability tradeoff. GLYNT.AI provides industry-leading accurate, audit-ready sustainability data while being more sustainable than alternatives
The framework developed for this analysis is both detailed and expandable, so that the results can be updated each year. Comments and feedback on this report are appreciated. Please send them to us here.
DETAILS
The GLYNT.AI System and the Reporting Boundaries
GLYNT.AI began our sustainability footprint calculations by analyzing our cloud usage detail from January 1, 2024 through October 31, 2024. GLYNT.AI uses the AWS cloud service. Here is a summary diagram of the GLYNT.AI system:
The GLYNT.AI Sustainability Data Pipeline

GLYNT.AI is AI-First, in that we started by using ML to support human-oriented tasks in a step-by-step workflow. But in early 2024 we flipped our model, and the entire workflow is optimized to deliver accurate data with efficiency. Human tasks are in support of ML optimization. This has increased our capacity significantly, and led to faster services – including onboarding – for customers.
Our cloud usage includes AWS tools for managing our service and the AWS Optical Character Recognition (OCR) engine. We use a rather basic set of features of the OCR, and add in our purpose-built machine learning and other code to obtain reliable accuracy and efficiency. GLYNT.AI can switch to the OCR engines provided by the other hyperscalers, Google and Microsoft, and testing shows that the three OCR engines perform at about the same level in our system. The data reported below includes our usage of AWS’ OCR but not the training of their service.
The boundaries of our study include data center usage for the four categories mentioned, but exclude two other areas of resource use: transfer of data across global telecom networks, and data center hardware. EPRI reports that global data transfers use the same total energy as data centers, approximately 220 MMWh per year. (12) Business users such as GLYNT.AI have no visibility into this task and its associated resource use. We hope to include it in future years.
Also excluded from the study is data center hardware. Data centers have numerous servers, which are replaced every two or three years. Within the server there are chips, which are key to progress in computing and energy efficiency. The embodied emissions in hardware and its replacement cycles are changing fast and there is no visibility for the typical business user. This too is excluded in our current reporting.
Organizing Cloud Usage Data
GLYNT.AI’s cloud usage comes from the three environments we run: development, stage and production. We combined stage and production for this analysis. On average, the development environment is 13% of total usage. Its usage data were removed from further analysis.
Next we categorized our usage into four groups: compute, storage, networking and other infrastructure as each has a different carbon intensity per unit of use. The Cloud Carbon Footprint (CCF) method for categorization of cloud data and bills was used. (3) This method has been used by other similar reporting endeavors, such as by Etsy and Climatiq.io (4) As noted by the CCF documentation, judgements are required, and when in doubt, we assign the usage item to the compute category, as this has the largest carbon content per unit of use. Throughout our work we have used similar conservative judgements as needed.
Third, we examined the two key areas of data center usage in AI: training and inference. AI can be thought of as an algorithm (e.g. a mathematical approach) and the output of the algorithm is trained models. The models are used again and again to meet user requests, which is known as inference. Based on data science analytics, user feedback and so on, the algorithm code base is updated so that the trained models perform better.
Early analysis of the environmental footprint of LLMs focused training, but recent work has noted that with use of LLM exploding, inference usage will dominate the environmental footprint. But the inference usage depends on a forecast of user adoption, the life span of the trained models before retraining, the pace of LLM development and more. Recently, researchers have taken another tack, looking at the energy burden of LLM inference usage by task. This excludes the training portion of energy use. We use the task-based approach here to normalize the data for an apples-to-apples comparison.
The GLYNT.AI implementation of Few Shot ML operates very differently than management of LLMs. GLYNT.AI’s Few Shot ML uses a library of tiny, tiny training models. Each model can be trained in minutes and needs just three training samples. The model returns data 98%+ accuracy rates from the start and so very little retraining is needed. This is in stark contrast to LLMs, which have enormous models trained on vast data sets, with frequent retraining.
Further, GLYNT.AI is built on a segmented database and ML model library so that we do not co-mingle customer data. When onboarding a new customer, GLYNT.AI creates a customer-specific library of ML models, there is no re-use across customers. Incredibly low cost training is a strength of our system and we exploit it for efficiency and additional security and privacy for our customers. Training and inference are handled on the same data center resources, and are nearly blended together from the start. Thus GLYNT.AI’s environmental footprint is for training and inference combined.
A recent paper from Hugging Face examined the energy and carbon footprint of various LLM algorithms. (2) Using a standard data set, the researchers compared the energy efficiency of various LLMs in inference mode. The researchers also organized the tests and results by task, such as text classification, text-from-image extraction and so on. A key objective of our work is to compare GLYNT.AI’s Few Shot ML to Hugging Face results, for the same tasks.
To obtain these results, we did a calculation thruline from choice of AI algorithm to energy and water usage as well as carbon emissions:
- The AI algorithm uses four types of data center resources: compute, storage, networking and other
- Switching between AI algorithms may impact any or all of these
- Each data center resource has a usage metric, e.g. KB of storage or CPU-hour
- Each usage metric has an electricity intensity, e.g. kWh per CPU-hour
- Each data center location has a carbon emissions factor, e.g. kg of CO2e per kWh
- Each electricity metric has an associated water metric, e.g. L of water per kWh
This chaining of values follows that of CCF, Etsy and Climatiq.io. See the Details section for more information. Given the tight linkages, the environmental resource metrics become interchangeable when describing relative usage.
Additional Comments on the Carbon Intensity of LLMs (e.g. the Hugging Face Graph)
As we reviewed the results of GLYNT.AI’s low carbon intensity, as seen on the Hugging Face graph shown above, we mentioned how the graph goes from simple tasks on the left to complex tasks on the right, illustrating the ecosystem of AI.
One example of the future ecosystem is the recent buzz around Retrieval Augmented Generation (RAG). (5) RAG feeds accurate, enriched data into the LLM algorithm, and reduces hallucinations. In the world of sustainability, data enriched with codes (join keys) from other business systems is particularly valuable for LLM performance. This includes general ledger codes from accounting, site codes from an ERP system, building attributes and status from leasing and financial systems and so on.
Researchers have found that the relationships between data can improve accuracy even further, such as when represented by a knowledge graph. Knowledge graphs – the web of data relationships – have been used to power google searches for over a decade, and are finding their place in techniques to improve LLM accuracy. Exposing the cross-functional relationships in accurate, enriched sustainability data makes it an even more valuable tool for LLMs. (6) As recent research from Microsoft explains, knowledge graphs provide a whole of dataset context.
GLYNT.AI has built in data customization and enrichment and our accurate, verified and enriched data feeds the “whole of business operations” view into LLMs.
Carbon Emissions in Context
To weave our way through the calculations, we put the selection of the AI algorithm into a larger data center and energy use context. While selecting an AI algorithm feels important, there are many other points of energy and water use in cloud computing. We built the graph below to articulate the larger picture. The graph also details the data item available at each point in the ecosystem, and its level of granularity. This helps to track the many data fragments reported on cloud computing, data centers and AI.
From Electricity Trading Region to AI Training Models
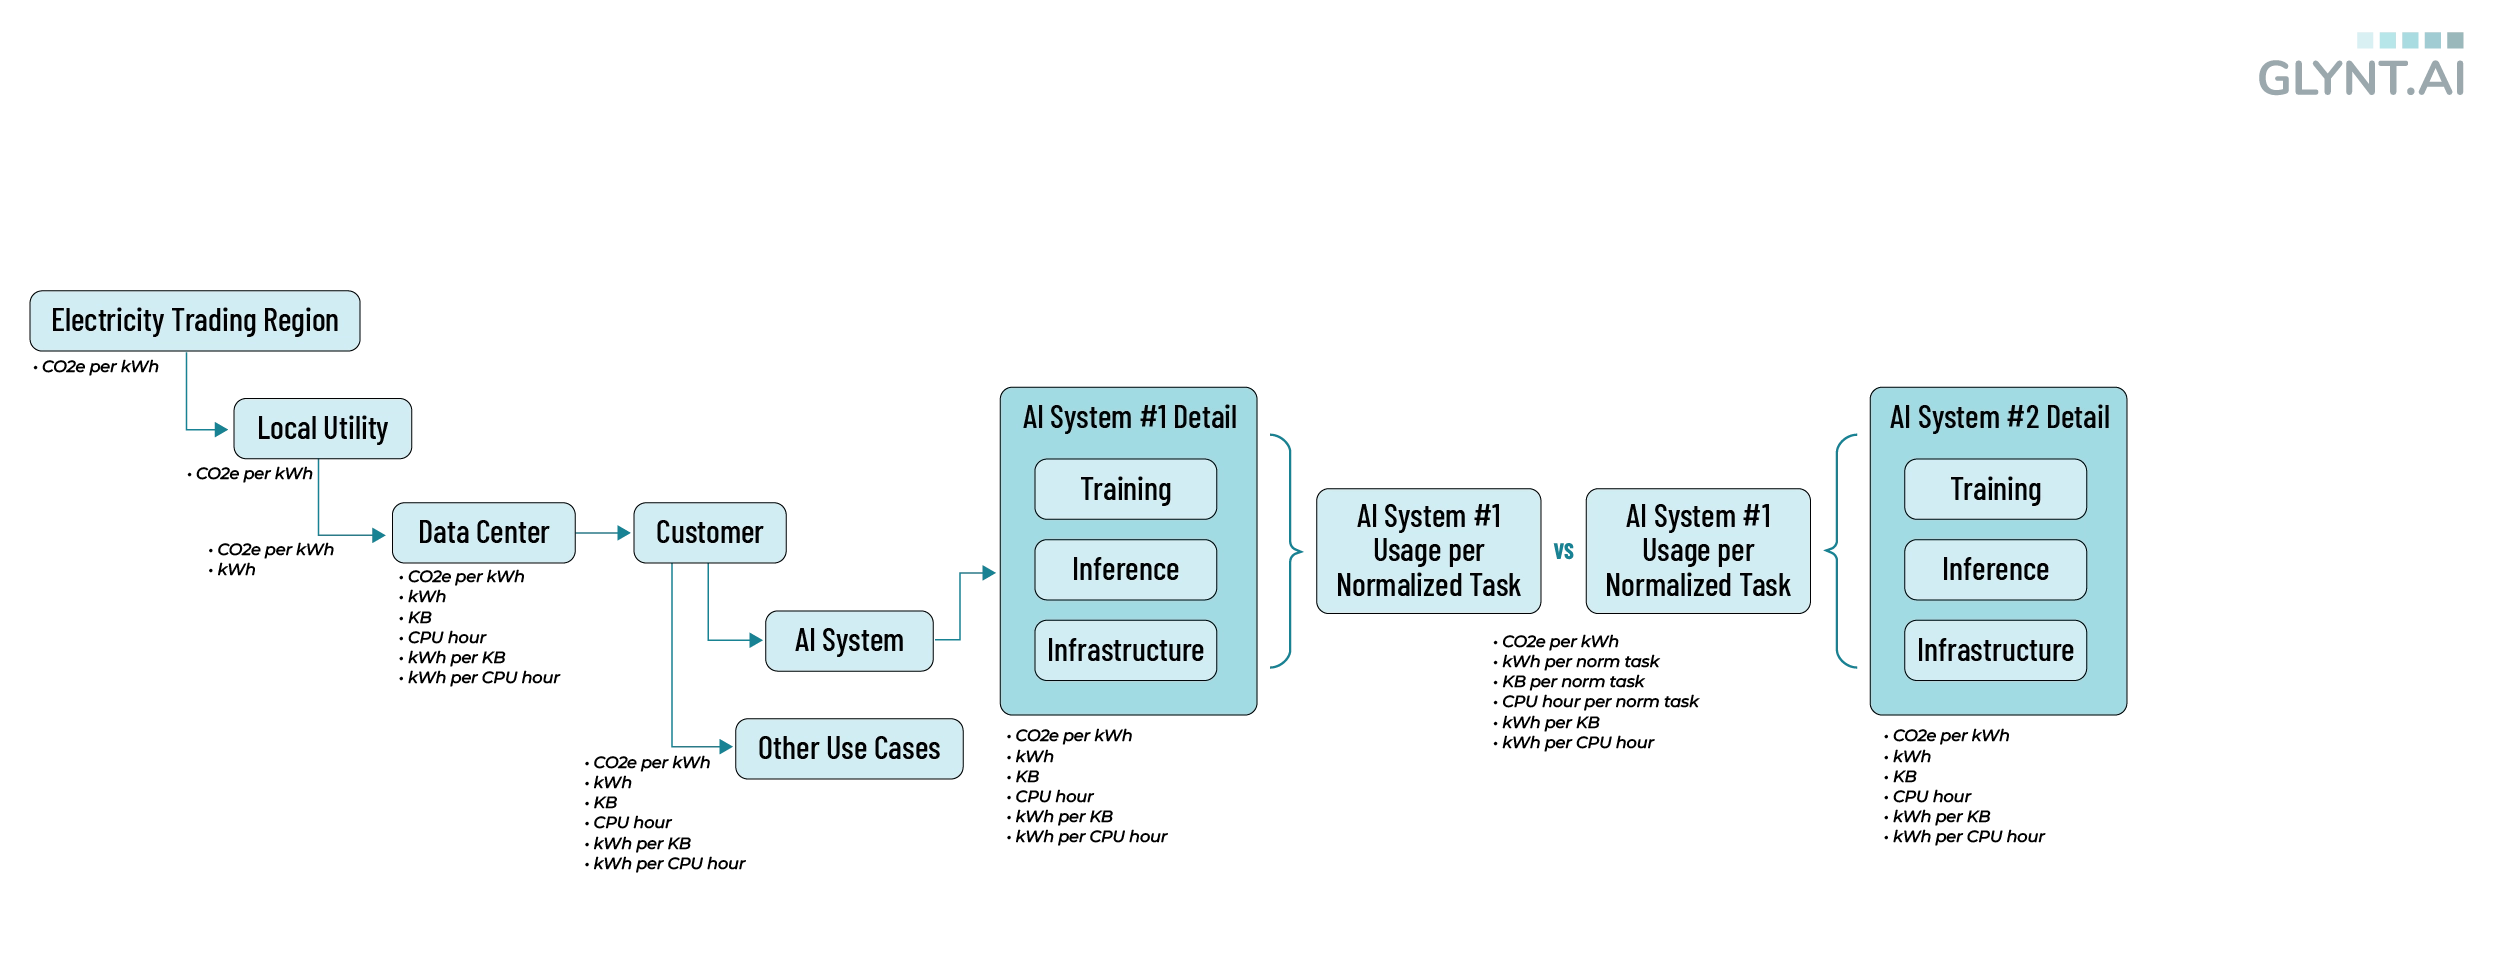
Starting at the left, the local utility provides electricity to the data center. The carbon emissions of the utility are determined by their trading region. (7) The data center is an electricity user and a business, such as GLYNT.AI, is a customer of the data center. The customer has an AI system and other uses. For example, perhaps the customer is also providing a full reporting dashboard to customers. The AI system is sub-divided into three components: Training, Inference and Infrastructure. Other researchers report that data center usage needed to support an AI system is typically 30–40% of the total usage. (8) To compare the choice of AI systems, one finds an alternate algorithm and system that is well-suited to performing the same task.
As mentioned earlier, GLYNT.AI’s data center usage is divided into usage by the AI system and usage for other reasons. We assigned our development environment to the Other Use Case and excluded it from this analysis.
GLYNT.AI’s infrastructure averaged 62% of total usage throughout 2024. This could arise for two reasons. First, GLYNT.AI is rapidly scaling, but is not at the same scale of usage as the large LLMs, and until we reach that scale our infrastructure component is naturally larger. Second, GLYNT.AI’s Few Shot ML could be simply just more efficient than LLMs, making the AI component smaller and the infrastructure component relatively larger.
Along the bottom of the graphic above, we note which data is available by section of the overall system. At the left, one sees that the carbon intensity of electricity is known once the data center location is known. The data center itself helps to determine the level of usage per algorithm, as the data center might be a highly efficient hyperscale center or a legacy small data center with much higher energy use per task. A typical business user simply reports the numbers, and is not aware nor has the scale of operations to influence this outcome.
Carbon Emissions in Context
To make clear how the choice of algorithm fits into the larger context of energy, water and emissions reductions, we added opportunities to decarbonize energy or reduce energy use to the contextual graphic. This is seen in the following figure.
From Electricity Trading Region to AI Training Models with Energy Savings and Decarbonization Options
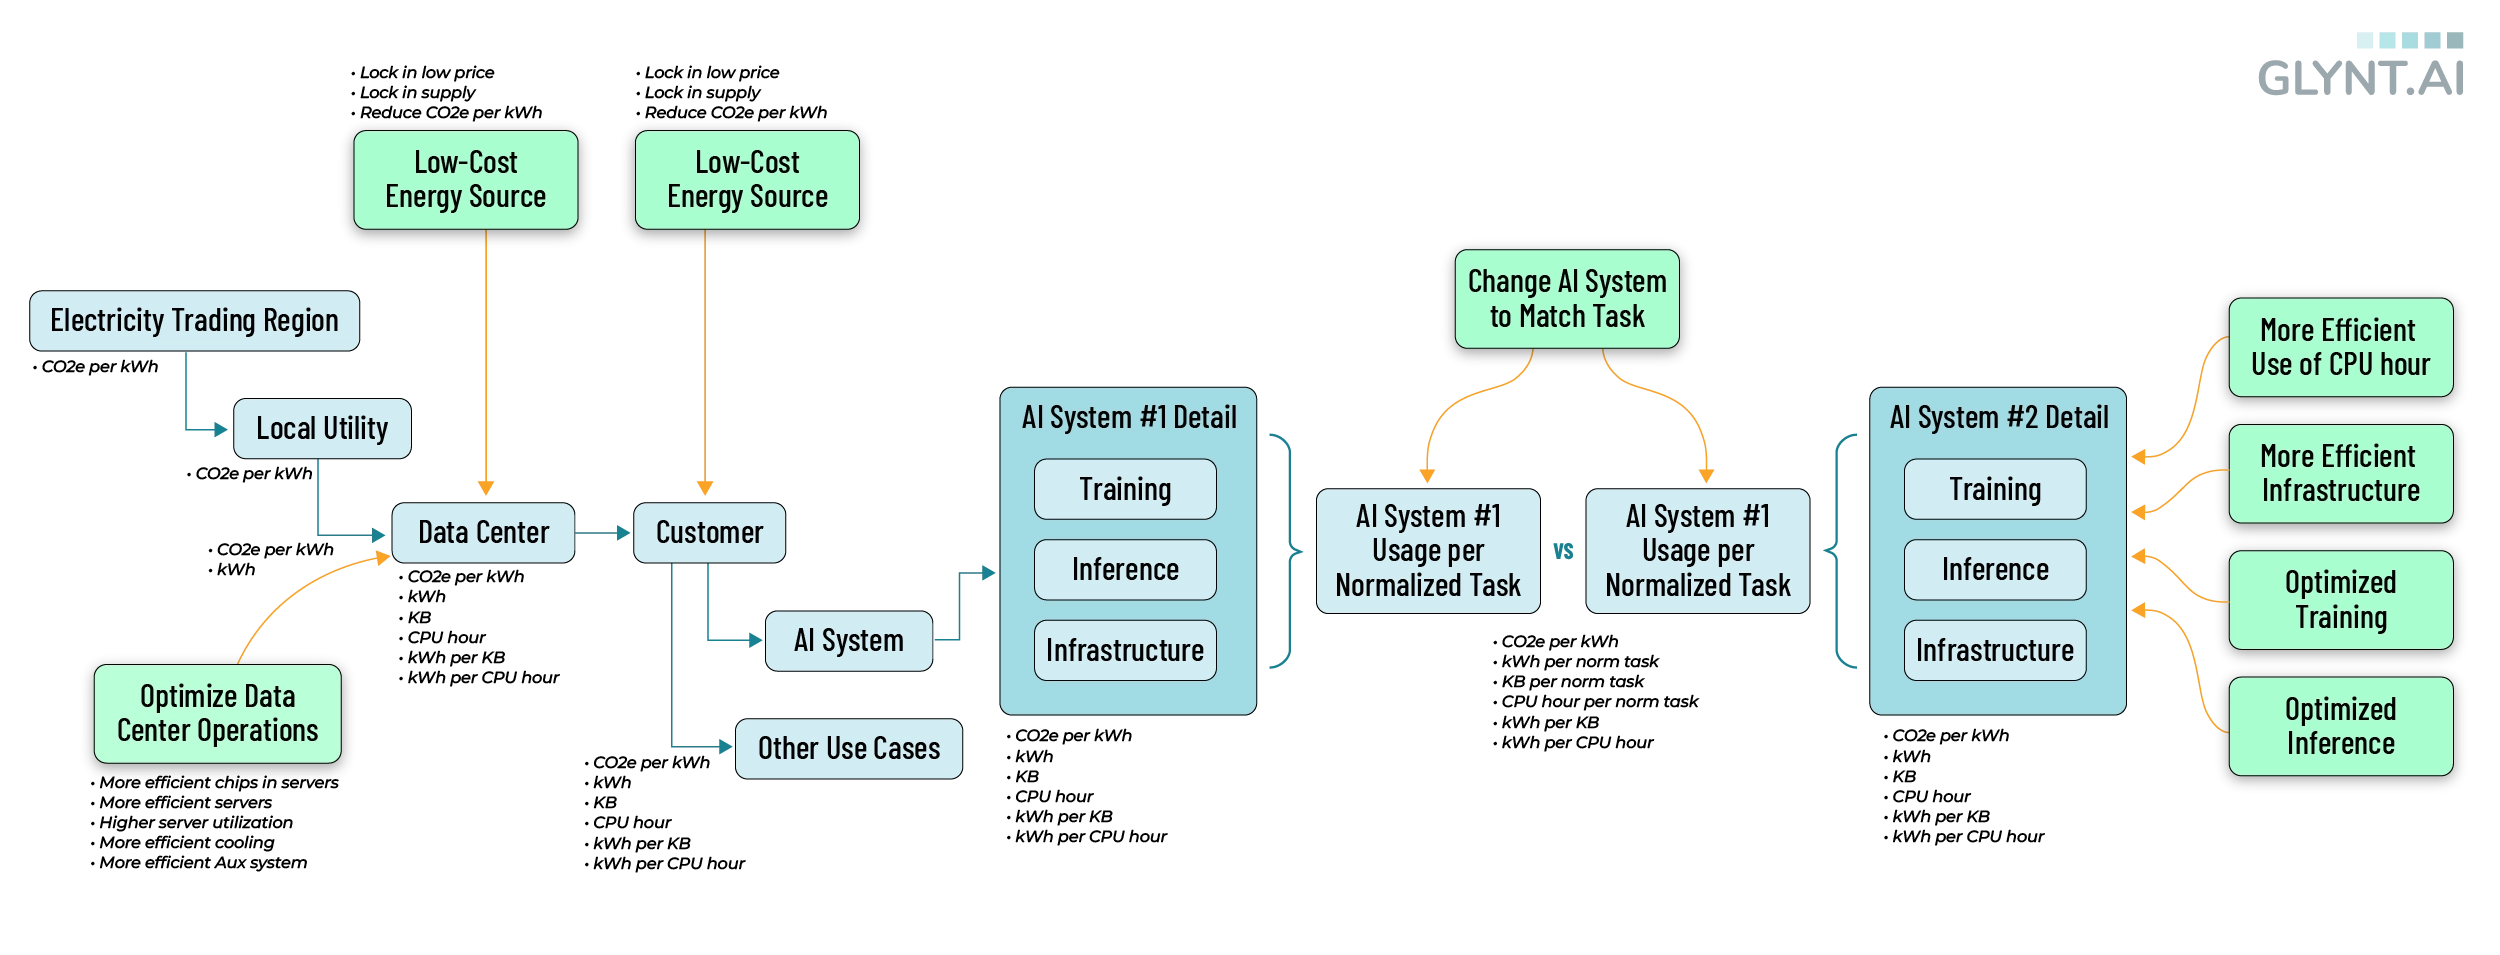
And finally, we make note of the hype and emotions surrounding AI, data centers and energy and water use. Broadbrush calculations that extrapolate from high-level data are common. An incredible amount of technical jargon is misread. This report has only one comment to make about this larger picture: Data centers are super-sized customers for every electric utility. Data center usage is growing fast. Electric utilities typically work on 10-year growth plans, and these are now useless as the optimal path forward for AI changes quickly within each year. The different timescale clash, leading to contentious conversations between data centers, utilities and other local customers. None of that impacts the analysis of this study. It does impact the business strategy of every GLYNT.AI customer, as there is a race on to secure low-cost energy and water from locally congested and constrained supplies
Emissions Factors
Emissions factors are often a weak link in carbon calculations and this is true for the calculations presented here. The issues are:
- Stale data. Data centers are rapidly changing, the use of AI is growing rapidly, and electricity markets are feeling the pressure. Fresh data on the carbon intensity of electricity by location is needed. But most studies on AI emissions use emissions factors released in 2017, 2020 and 2021. And the reported emissions factor is based on actual data from prior years, so the emissions factor is even more stale!
- False precision. The emissions factor reported by Google for networking in a Las Vegas based data center is .0004054 kg CO2e per GB. (4) No doubt the emissions factor is carefully produced by Google based on data center averages of some kind, but it conveys scientific precision while in fact it is a coarse approximation.
- Regional variation in the carbon content of electricity. The carbon intensity of electricity in the continental U.S. varies from a low of 497 pounds of CO2e per MWh in California to a high of 1479 pounds of CO2e per MWh in eastern Wisconsin. (7) TThis is a three-fold span in carbon intensity, but the location of data centers is often left out their emissions analysis. The impact of location dwarfs other factors and this omission is a significant.
For typical data center use, we suggest using the data sets available from Climatiq.io, as these are carefully assembled by location, consistently documented and updated as new data becomes available. (4)
We note that we included the data center location in our assignment of emissions factors.
Water
Data centers put pressure on local water resources, as data centers use water for cooling and use electricity, which in turn uses water for power generation. Rigorous studies of the environmental footprint of data centers, such as that by LBNL, draw their boundaries more broadly than those used in our work. The LBNL researchers find that takes an average 7.6 liters of water to generate 1 kWh of energy in the US, while an average data center uses 1.8 liters of water per kWh consumed. (9) Thus, in total, data centers use 9.4 liters of water per kWh. This is the total impact of data centers on local water supplies and is alarmingly high.
The LBNL researchers note that location matters for data center water use, with a nearly 100X range of water use per kWh across the U.S.. The same conclusion is noted in a recent interview with a data center facility management company, with stated variation from 0.01 L/kWh to 1.5 L/kWh or higher. (10)
GLYNT.AI’s energy use is far below that of LLMs, and thus in the chain-linked calculations of this study, its water use is lower as well. There is no data available on water use by data center location, so we use the LBNL average of 1.8 L per kWh in our analysis.
References
1. AI Standards and Crosswalks to the NIST Artificial Intelligence Risk Management Framework (AI RMF 1.0),NIST
2. Power Hungry Processing, Hugging Face. See the citations therein.
3. Methodology, Cloud Carbon Footprint
4. Measuring greenhouse gas emissions in data centres: the environmental impact of cloud computing, Climatiq
5. How an Old Google Search Trick is Solving AI Hallucinations, The Information
6. GraphRAG: Unlocking LLM discovery on narrative private data, Microsoft Research Blog
7. GHG Emission Factors Hub, EPA
8. See the discussion by Hugging Face in (2)
9. The environmental footprint of data centers in the United States, IOP Publishing, Environmental Research Letters
10. Powering Intelligence: Analyzing Artificial Intelligence and Data Center Energy Consumption, EPRI
Next Steps
Ready to see what GLYNT can do for you and your company?
Reach out to our team!
More Like This
The Tech Stack for Sustainability Data
A deep look at the features and functionality behind finance-grade sustainability data
Read the Guide
Awesome Sustainability Data
Read the Guide
The Sustainability Data Buyer’s Guide: Unlock Value with Automation
Read the Guide
Contact GLYNT.AI

New to GLYNT.AI
© 2025 GLYNT.AI, Inc. | #betterdatafortheplanet | Terms of Use | Privacy Policy | Compliance Framework
