Three Pillars of Value
INTRODUCTION
The World has Changed: It is All About the Business Case Now
With the change in U.S. president and policies, many sustainability managers are rattled. Is there a rationale for their daily work? Are jobs, teams and efforts at risk? This guide lays out three immediate opportunities to build value with sustainability data and reporting that goes far beyond the cost of the sustainability team’s activities. With a focus on energy and water savings, meeting investor’s reporting and data demands, and preparing high-quality data for enterprise AI, sustainability teams change from a cost center to center of value and profit creation.
In our new era, the role of the sustainability team takes on a sharp, clear focus: The team is the subject matter experts working under finance and compliance, speaking the language of business impact and delivering quantifiable business wins. The new role goes beyond reporting to building the business case for profitable actions that are discovered and shaped with the sustainability lens. This trajectory normalizes the sustainability function by putting inside the standard business framework of quantified business cases, capital budgeting reviews, finance team approvals, and possibly external project financing.
The three enduring pillars of value also reveal a change in perspective. Today’s sustainability agenda is set by external forces that are driving strategic, company-wide challenges. Accurate, reliable sustainability data is a key part of the finding the strategic response. After all, “You can’t manage what you don’t measure.” If sustainability teams want to be relevant, they need high-quality data.
Why Focus on a Strong Business Case?
If the business case for sustainability data is so strong, why didn’t companies force this focus and discipline before? The answer is: Fast-moving, large economic forces of change. Strategic challenges have emerged that simply weren’t there two and three years ago.
Here’s are three examples of what’s new.
Disappearing Government Incentives
- The past: Generous government incentives tipped corporate investment decisions.
- The future: Every business opportunity must quantitatively demonstrate profits or value creation on its own merits.
Convergence of Technology and Sustainability
- The past: Technology advances reduced the carbon intensity of the US economy by 55%, as measured by MT CO2e per $ GDP (1).
- The future: Rising demand for AI leads to a doubling of electricity use, and potentially carbon intensity by 2030.
Convergence of AI and Sustainability
- The past: Hand-keyed, annual sustainability reports were “good enough”
- The future: Investors use AI to analyze every scrap of data released by a company. They can get higher returns when a company reports sustainability data tied to financial reporting.
In each of these examples, an external change has made high-quality, sustainability data a must-have. The old sustainability team advice was to find new products markets that are good for business and good for the planet. The new advice is: Use your unique sustainability lens, supported by awesome data, to address the strategic challenges facing your company.
The New Priorities for Sustainability Teams
Here’s a quick summary of what the three pillars of value mean for the sustainability team’s priorities.
Gear up. It’s time to learn about finance, capital budgeting, data operations and compliance. Sustainability is coming out of its silo. Get the skills of a normal cross-functional business team.
Focus on quantifiable impact. For example, use granular and fresh sustainability data to identify locales and projects that secure low-cost energy.
Think outside in. Talk to investor relations and external company analysts. See how they use your sustainability reports and data sets. Then improve your data to increase the size of the investor pool.
Race towards AI. Demonstrate how sustainability data fits into the enterprise AI trajectory. Don’t get left behind as the rest of your company turns it attention to AI.
And keep on reporting. Your customers and investors will demand it. Reporting software can make this job much easier. Create a data and reporting framework that goes deeper and wider each year
See our collection of resources for sustainability teams: Build the Business Case for Change
Three Pillars of Value for Sustainability Data
This section reviews three business priorities, and the role of sustainability data. The priorities start in familiar territory, energy and water costs, but quickly extend out of the usual climate/carbon accounting/sustainability silo, and form the pillars of value. This reflects the normalization of sustainability data in everyday business practices.
#1 Energy and Water Savings
Skyrocketing demand leads to fast price increases. The image below tells the story. After decades of nominal 0–2% annual growth, the demand for electricity has skyrocketed and is expected to increase 150 to 200% by 2030. Electricity grids are not set up for this fast change, so the result is rapid price increases. The surge in demand is driven by bitcoin mining, online streaming, AI and the switch from natural gas to electricity heating and the switch from gasoline to electricity for driving. These drivers will slow down in the face of rising prices, but collectively they will still grow demand far faster than electric utilities can increase supply. Water use is strongly linked to energy use – via water cooling systems in data centers and water usage in electric power generation – expect rising water prices and water supply issues to follow.
Rising Electricity Prices Across the U.S.
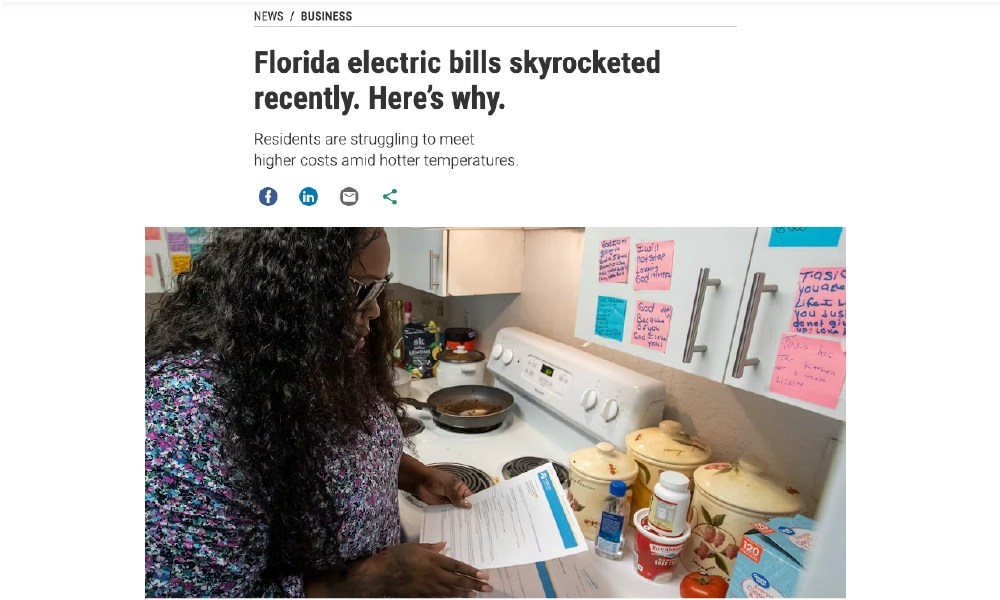
FLORIDA
- 17% increase in electricity rates in 2024
- 50% increase over the past 5 years
Source: Tampa Bay Times
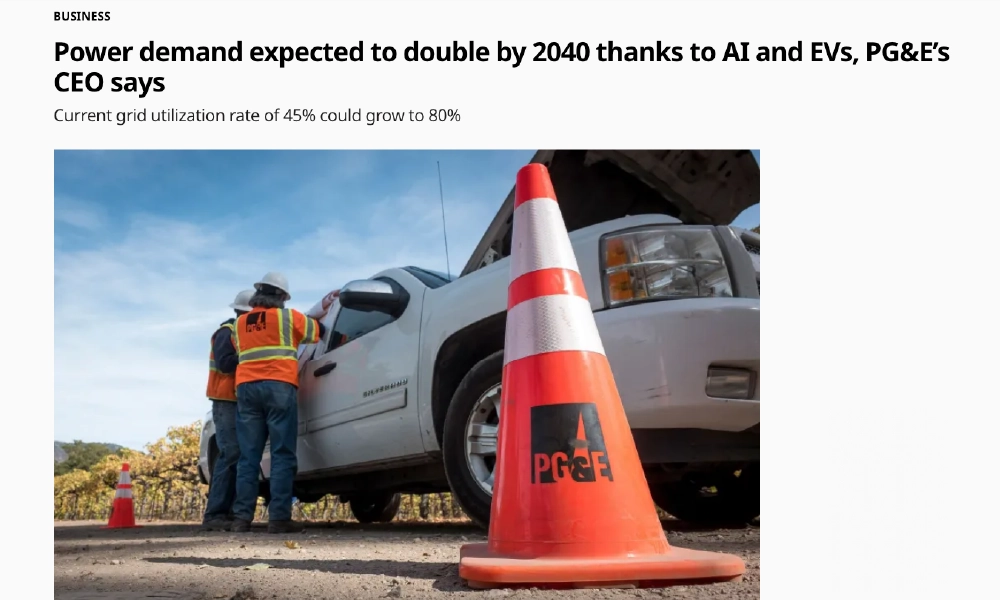
CALIFORNIA
- 2X growth in long-term demand forecasted
- 12–25% rate increases per year, 2024 & 2025
Source: siliconvalley.com
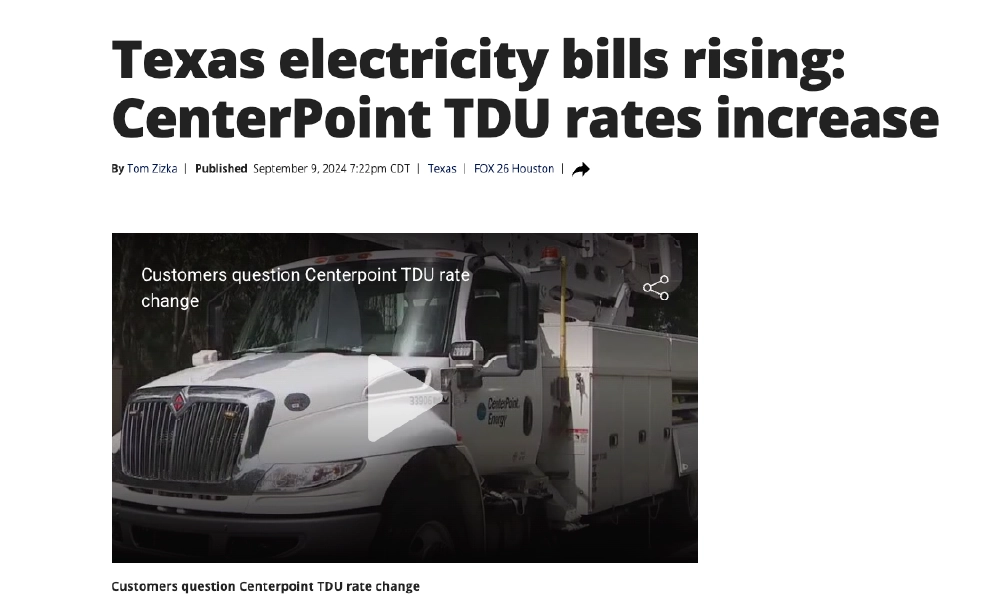
TEXAS
- Rates rising up to 40% month over month
- Market has less long-term planning, more sudden increases
Source: Fox26 Houston

US NORTHEAST
- Up to 800% cost increases by June 2025
- Limits on supply growth due to reliance on imports from Canada
Source: Reuters
There’s a second angle to this story that defines how to act. Much of the surge in electricity demand is coming through data centers, with the number of U.S. data centers expected to grow by 50%, and the amount of electricity used per data center is expected to grow by up to 500% per site as data centers become bigger and more dense. (2).
And the impact of data centers is extremely local. For example, in late 2024 Silicon Valley Power, a local electricity provider serving the city of Santa Clara in the heart of Silicon Valley, California, announced that it expects electricity demand to double in its service territory by 2030. (3). This is in sharp contrast to previous forecasts of under 1.5% demand growth per year (4), and in contrast to the neighboring Silicon Valley Clean Energy entity, which forecasts a demand reduction from increased energy efficiency. (5).
What happens when a data center is planned in your local area? The maps below show how much localization matters. Each service area is very small, putting huge pressure on the local energy and water utilities to increase local capacity. Power resources from outside the service territory may be of limited value if the local grid is capacity constrained and cannot bring them.
The Large Number of Local US Electricity Utilities

The Large Number of Local US Water utilities

Localization compounds the challenge. For sustainability teams the localization of energy and water issues is an opportunity and a challenge. The opportunity: Rapidly rising local prices means savings projects that could not pencil out (costs were greater than savings), may have a strong ROI now. The challenge: Sustainability teams need granular, fresh, local data to build the business case for savings projects.
Most businesses will be simply an electricity user in an area hit by rising electricity prices, capacity constraints and slow-moving local utilities. Sustainability teams can lead the way on key business opportunities for their company by using comprehensive, granular, finance-grade data on energy and water that is updated every month, with sub-metering detail as needed. To build the business case for projects that reduce use or secure low-cost supplies, you’ll need finance-grade data that enables four actions: scan all locations; identify savings opportunities; build the business case; get it financed. That’s finance-grade data from GLYNT.AI.
See our Guide Awesome Sustainability Data
#2 Investor Demands
Investors can make money from sustainability data. And financial market data providers are feeding this demand, making money from providing useful streams of sustainability data. Companies that don’t tell their own data-driven story will find that investors fill in a narrative that assumes the worst. Meet the investor need for accurate, verified sustainability data and increase your pool of investors, access to capital and the value of your company. Data seldom has this much impact. Seize the moment!
Three facts drive investor demand for sustainability data.
A. The cost of climate change is here.
B. Corporate sustainability data is widely available to investors
C. Investors can make money from climate change through the reported data
A. The Cost of Climate Change is Here
The map below illustrates some of the cost of climate change, showing every event in the U.S. with $1B or more in losses. The number of such events has increased by 300% in recent years. And look where the icons are clustered, in the U.S. heartland. The cost of climate change is hitting Iowa and Kansas, not just Houston and Miami. As recent headlines show, a disaster is followed by increased costs of insurance for homes, businesses and autos, inflationary spikes in construction costs, rising housing costs, and huge infrastructure repair programs. It takes years to recover. Investors watch this economic disruption and invest accordingly.

B. Corporate Sustainability Data Is Widely Available to Investors
While most sustainability teams have caught the message, “build the business case for change”, many have not yet heard an equally important message, “investors see and use everything you report.” This second message applies to any private companies too. The graph below shows how data in corporate reporting flows into the financial markets. Bloomberg and other financial market data services sell subscriptions to cleaned and structured sustainability data. In fact, Bloomberg terminals harmonize financial, sustainability, physical risk and environmental data for each company, and investors use AI and other tools to select companies for investment. The graph below shows two investor use cases, hedging out climate risk and selecting the best performer amongst peers. These are discussed in the next section.
How Sustainability Data and Reports Are Used by Investors

The graph shows that the four data types (financial, sustainability, physical risk and environmental) all feed into a unified profile of the company. What is not widely recognized is that EU regulatory filings through the CSRD are passed to the NZDPU, which has data sharing agreement with Bloomberg. This applies to public and private companies. Similarly CDP filings flow into Bloomberg data services through a data sharing agreement.
For sustainability teams this means that all data is under strong scrutiny. AI tools don’t care where the data comes from, they simply use all the available data to make the best predictions of returns. And investors have found that sustainability data increases the accuracy of these predictions, so they are willing to pay Bloomberg and other financial data services for access to sustainability data. And don’t underestimate the coverage and speed. Public and private companies can report one month, and face investor questions the next. It’s a new world.
C. Investors Make Money from Sustainability Data
Investors take in the Bloomberg data and data from other sources and then use AI to refine their investment decisions. AI models – and investors – don’t categorize the data, they treat each company as a unified data profile. It’s all math, no politics. It’s all about making money. The change in U.S. presidents does not affect their needs.
Investors want to pick the best investment from a group of peers. Typically, investors have asset allocation mandates. For example, an investor might be required to hold 20–30% of all assets in the automotive sector. The investor wants to find the best investments within the sector. Lower energy and water use demonstrates less risk and lower costs, as does lower waste generated. These data may also signal proactive management, and that signal can be further amplified by a lower carbon-intensity of revenue. Companies also release their energy, water and emissions reduction plans to investors, again demonstrating proactive management, capital efficiency and pace of innovation and change.
Note that investors are not looking for specific “green companies”, such as a solar company that derives revenue from a technology that supports a climate change agenda. They are looking for the best-performing companies in a set of sector peers, where performance is measured by investor returns.
In the long run investors don’t want to hold carbon-intense stocks and assets, as these are seen as having a brittle, risky business model. These companies are expected to go through waves of consolidation, and not all will survive. As one investor puts it “no one wants to be left holding the bag of carbon (9).” To compensate for the slow and continual erosion of their value, carbon-intense companies may take actions to boost investor returns, such as stock buybacks or raising dividends. Of course this works in the short-run, but it simultaneously increases investor concerns about the long-run.
So in the short run, the best performing stocks may be more carbon-intense, but this is not a stable situation. Returns will shift to investments that are better equipped to survive and thrive in a world with climate change.
Investors want to hedge out climate risk. Eliminating macro economic climate risk from a portfolio of investments may sound quite ambitious as climate change is pervasive, but the data shows it can be done. A stream of academic research initiated by Nobel Prize winning economist Robert Engle shows how to form a portfolio by selecting two types of stocks (10). The first group of stocks rises in value when there is climate news and the second group falls in value with climate news. To hedge out climate risk, one holds a balanced portfolio that goes up and down in equal measure for each climate news event. Of course, the portfolio has to be constantly rebalanced to ensure minimal losses. Engle and others have shown how effective this hedge can be, and now it is now widely used.
Again, investors use the data available on the Bloomberg terminal and in other places, combine that with AI and select the financial instruments for their portfolio. Climate risk is not really just a single news event, such as “hurricane hits Florida”, it is a set of economic consequences. Here’s an example: n 2019 PG&E, the large electric and natural gas utility in California declared bankruptcy, in what The Wall Street Journal called “The First Climate Change Bankruptcy.” In 2017, before the fires, PG&E was worth $36B. In 2019, stock value was less than $3B, debt exceeded assets by $20B, the utility owed $30B in liabilities and faced another 750 lawsuits. Today, in 2024, customers still have a fee on each utility bill from the 2019 bankruptcy, as regulators passed some – but not all – of the cost of bankruptcy onto customers. And in 2019, Edison, the parent company of Southern California Edison which is another large electricity provider in California, experienced a 52% drop in stock price. It took over three years for the stock to regain its former value. (11). This is a complicated financial story with long-lived spillovers to other companies. Welcome to the ”cost of climate change.” Investors need all the data they can get!
Companies that cherry pick reporting, have disclosure errors or don’t report will not appeal to AI-powered investors. Company valuations rest on accurate, complete and reliable data that investors trust. They use it directly, and they use it as a signal of effective company management.
#3 High Quality Data for Enterprise AI
The AI-powered world is coming at us fast, but there is a key friction in corporate adoption of LLMs) Lack of suitable data. It is hard to believe, but LLM algorithms (aka Chat GPT and similar offerings) were trained on nearly the entire internet. To get the best of importing these pre-trained algorithms, companies need to add their own training data. And that training data had better be accurate, because with relatively few data points to train on the algorithm is going to overuse any error and start making errors (e.g. hallucinating). In short, advances in the adoption of AI at the enterprise level rests on having a volume of great data.
Sustainability teams have a wonderful opportunity to meet the moment. Clearly spreadsheet-based data systems won’t meet the accuracy and volume needs of enterprise AI. But automated, finance-grade sustainability data systems can. Sustainability teams can leapfrog to the front of corporate AI strategy by delivering. streams of accurate, granular data. Further, recent studies have shown that when LLMs use data enriched with metatags, accuracy improves. (12) So as sustainability teams enrich and customize data, such as with SAP code, GL codes, site lists and so on, it serves the enterprise AI agenda.
The graph below shows a high-level view of enterprise AI and data flows, with a focus on the role sustainability data. In the bottom row are the various business systems that produce data. The volume of data varies significantly by function. Digital marketing will have enormous volumes of data, and accounting will provide much smaller data sets. The data must stream from each siloed function into a central location, so that it can be further prepared and structured for use by enterprise AI. The specifics of the technology supporting the centralization of data is not important, what is important is the realization that unified cross-functional data will be significantly more valuable to enterprise AI than siloed data.
The data is prepared for enterprise AI, and then experimentation, training and production-grade systems can be established. These feed three common use cases: use of AI to automate tasks, such as customer service, or internal HR responses; use of AI to do sweeping analyses across the unified data, discovering previously unseen efficiencies; and then with first experiences in hand, coordinating a new enterprise tech stack. For example, if unified enriched data is key to accurate AI, why not prepare the data that way from the start? These lines of inquiry, plus new offerings by innovative technology providers, will change how we think about the enterprise tech stack.

In Sum
With an automated sustainability data service, the sustainability team can leapfrog over legacy setups and deliver highly accurate, enriched sustainability data. When enriched with cross-functional metadata from ERP systems, finance and procurement, granular data on water, energy, waste and emissions is a window into the core of the company’s operations and potential efficiencies. With the incredibly rapid pace of improvement in AI, sustainability data acquires value far beyond its current use in reporting.
For sustainability managers, the action item is simple: Put sustainability at the heart of your company’s strategy by making accurate, enriched sustainability data available to your company’s enterprise AI. Sustainability teams that don’t take this step will find themselves further siloed and with less impact.
Want to Learn More? Talk to GLYNT.AI
Sources
1. Climate Change Indicators: U.S. Greenhouse Gas Emissions, EPA
2. How Many Data Centers Are There and Where Are They Being Built?, ABi Research
3. 2023 Integrated Resource Plan, Silicon Valley Power
4. California Energy Demand 2018–2030 Revised Forecast, California Energy Commission
Note that California uses a 12-year planning cycle so the forecast was not updated in 2020. In 2022 the state issued an updated forecast to 2035, showing 1.3% annual average growth.
5. Standard LSE Plan, Silicon Valley Clean Energy
6. Electric Retail Service Territories, US. Energy Atlas
8. Billion-Dollar Weather and Climate Disasters, National Centers for Environmental Information
9. See GLYNT.AI’s Follow the Money
10. See GLYNT.AI’s Follow the Money and Nobel Laureate Robert Engle: Hedging Future Risks Through Today’s Choices, NYU Shanghai
11. PG&E: The First Climate-Change Bankruptcy, Probably Not the Last, The Wall Street Journal, and Pacific Gas & Electric Market Cap 2010-2024 | PCG, Macrotrends
12. How an Old Google Search Trick is Solving AI Hallucinations, The Information, and Unleashing The First Forrester Wave™ For Vector Databases, Forrester
More Like This
GLYNT.AI's Energy and Water Efficient AI
Read the Post

Integrated Reporting
Read the Guide

The Tech Stack for Sustainability Data
Read the Guide
Contact GLYNT.AI
New to GLYNT.AI
© 2025 GLYNT.AI, Inc. | #betterdatafortheplanet | Terms of Use | Privacy Policy | Compliance Framework